When it comes to Performance Monitoring and analysis, we tend to think of full fledged license tools like Dynatrace, Newrelic, Appdynamics, Yourkit etc. However, if it is a java application which is under diagnosis, java’s built in tools are a good place to start.
Java comes with a set of built-in diagnostic tools like - Jconsole, jcmd, jstat, jmap, jstack, jvisualvm, jfr and many more. Each of them help in tackling a kind of problem. For the scope of this article, lets look in to how jstat is useful as diagnostic tools.
Jstat :
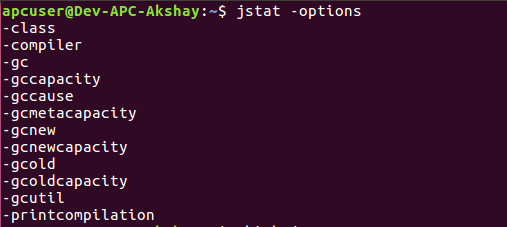
To know all the capabilities of jstat utility, list the options it has like below.
Gc: Using jstat along with one of its many gc options, one can monitor live gc stats from a java application. Out of all the capabilities of jstat, I like how jstat provides extensive gc stats.
In the below snapshot - “3787” is the pid of the java application and 1000 represents the milli-second interval for every snapshot. Although the number of columns might seem overwhelming in the output below, first 12 columns speak about current capacity and current usage of a space.
First two columns “S0C” and “S1C” talk about “Current survivor space 0 capacity (kB)” and “Current survivor space 1 capacity (kB)”.
“S0U” and “S1U” talk about “Survivor space 0 utilization (kB)” and “Survivor space 1 utilization (kB)”
Similarly, the adjacent columns talk about Eden space, Metaspace and Compressed class space.
Below are the other metrics reported :
YGC: Number of young generation garbage collection events.
YGCT: Young generation garbage collection time.
FGC: Number of full GC events.
FGCT: Full garbage collection time.
GCT: Total garbage collection time.
Also, to get the gc stats for individual spaces, you could use other options like -gcmetacapacity, -gcnew, -gcold, -gcoldcapacity etc.
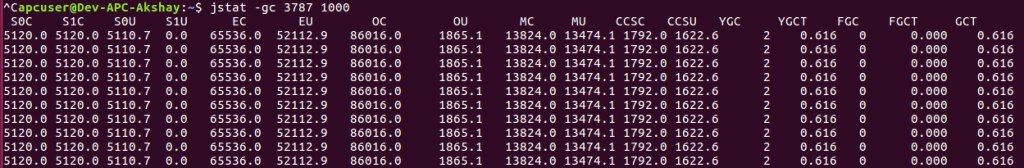
jstat -gc
gccause : This prints the cause for the last GC and current GC.
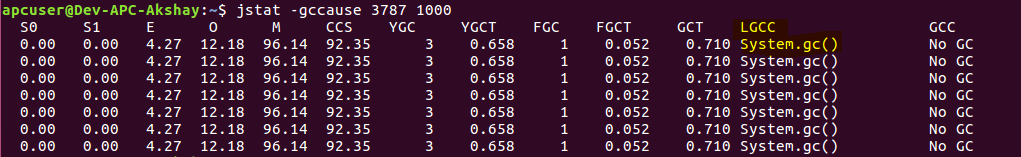
jstat -gccasuse
gcutil: This is the option I generally use to get the overview of Garbage collection since it gives a concise Summary of garbage collection statistics. Below stats are represented as the percentage utilization of a spaces current capacity (S0, S1, E, O, M, CCS).
YGC represents the number of young gen garbage collections since the start of process and YGCT represents the time spent on it. Similarly FGC and FGCT for Full gen.
GCT represents Total garbage collection time.
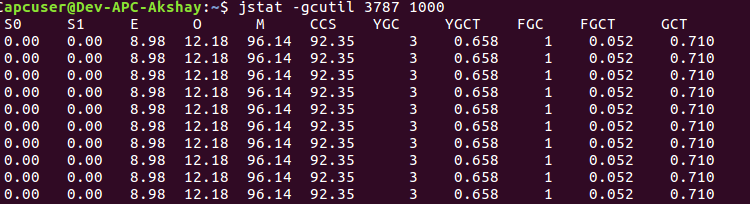
jstat -gcutil
Class : This option along with jstat will display statistics about the behavior of the class loader.
As seen below, the outputs lists the number of classes loaded & unloaded, memory impact due to loading and unloading and Time spent performing class loading and unloading.
These metrics are helpful when you want to metrics around number of classes loaded for your application.
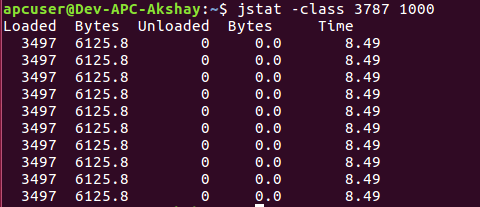
jstat -class
Compiler: This prints java’s virtual machine JIT compiler statistics.
As seen in below snapshot, it lists the number of classes compiled, time taken for the same, Failed compilations if any, along with Failed method details.
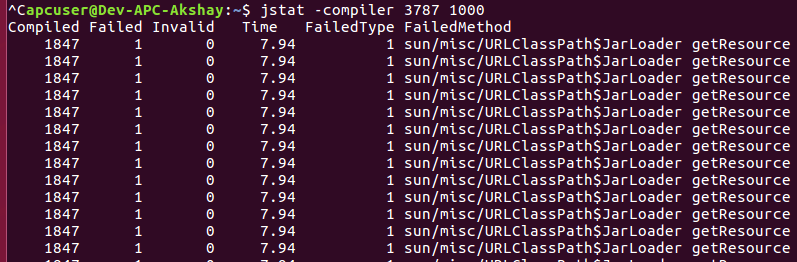
jstat -compiler
Official documentation link - here
Happy tuning!